
pito-compare
The charts tool behind PITO MD's numbers. You write the numbers in a small JSON or TOML file, and pcmp draws them as dark, crisp PNGs in a hand-drawn pixel font: two or more parties side by side on one axis, how many times faster or slower one is than another, or plain bars.
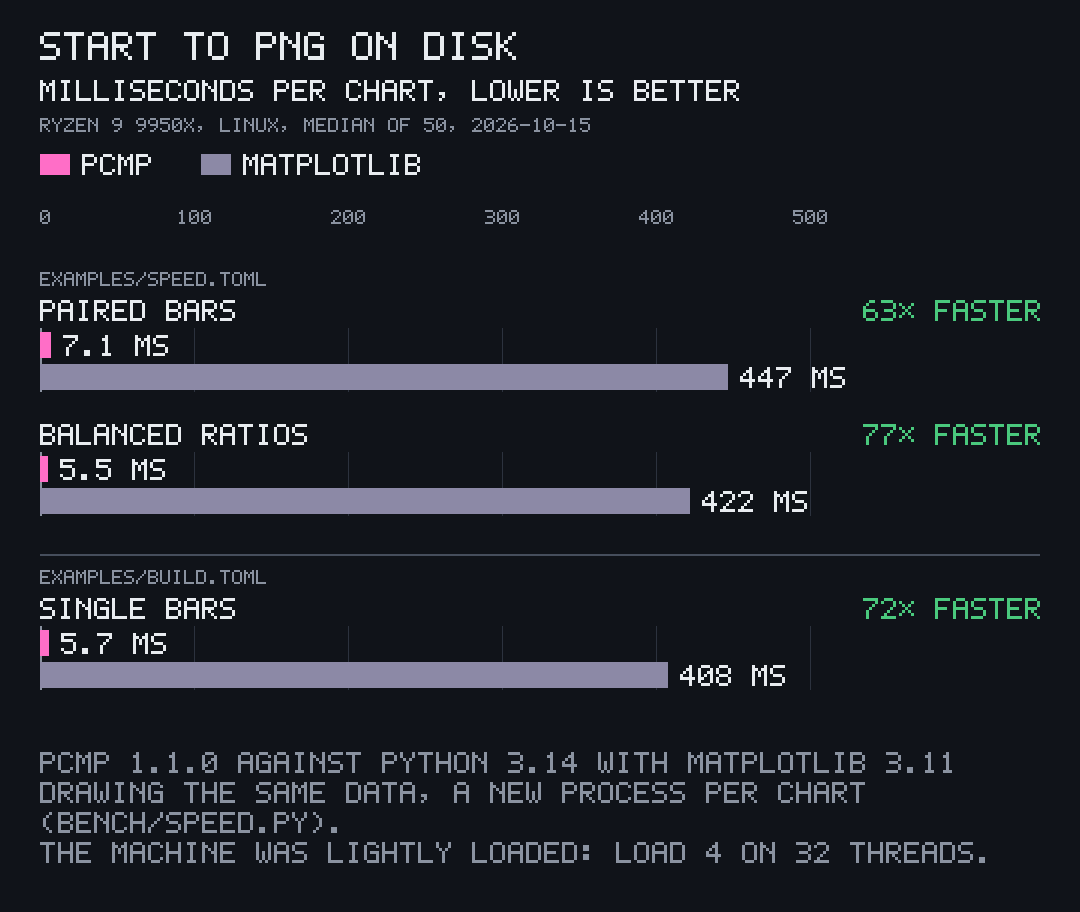
5 to 7 ms a chart, 63× to 77× faster than matplotlib Start to PNG on disk, a new process per chart, median of 50 runs: 5.5 to 7.1 ms against matplotlib 3.11's 408 to 447 ms on the same data. Measured 2026-10-15 on an AMD Ryzen 9 9950X, load 4 on 32 threads, for pito-compare v1.1.1's README.
- 5.5–7.1 ms start to PNG on disk, per chart
- 63×–77× faster than matplotlib 3.11 drawing the same data
- 12.9 MB peak memory; matplotlib took 82.5 MB
- 1.2 MB one binary: no Python, no plotting library, no system fonts
- 1,271 non-blank lines of Rust, canvas, pixel font and charts included
Numbers people read at a glance
Benchmark results read best as a picture, and a picture that looks the same every time.
What it's for
- Benchmark charts for a README, release notes, docs or a site, from the numbers your bench prints.
- Two or more versions, tools or settings on one axis, with how many times faster or slower printed beside every row.
- Charts in a script or CI: one file in, PNGs out, exit codes you can trust, nothing else installed.
Who it's for
- Library and tool authors who publish numbers and want them read in a second.
- Projects whose charts, from every run, should sit side by side in one look, 1080 px wide.
- Rust programs that draw charts from their own data through the library, with no command line and no clap.
There is no plotting library: the canvas, the 5x7 pixel font and the PNG writer are a few hundred lines of Rust, so a chart is drawn the same, pixel for pixel, on every machine.
Speed
pcmp draws its own benchmark: a new process per chart, 50 runs each, then matplotlib drawing the same data the same way.
Every number, and how
The ratios, peak memory, binary size and build time, with the bench that took them, are on the Speed page.
Use it
pcmp runs on Linux (x86_64), Windows (x86_64) and macOS (Apple Silicon). Each release carries a binary for all three, with a SHA256SUMS file.
v=$(basename "$(curl -fsSLo /dev/null -w '%{url_effective}' https://github.com/gmrdad82/pito-compare/releases/latest)")
mkdir -p ~/.local/bin && curl -fsSL "https://github.com/gmrdad82/pito-compare/releases/download/$v/pcmp-$v-linux-x86_64.tar.gz" | tar -xz -C ~/.local/bin pcmpv=$(basename "$(curl -fsSLo /dev/null -w '%{url_effective}' https://github.com/gmrdad82/pito-compare/releases/latest)")
mkdir -p ~/.local/bin && curl -fsSL "https://github.com/gmrdad82/pito-compare/releases/download/$v/pcmp-$v-macos-arm64.tar.gz" | tar -xz -C ~/.local/bin pcmp$v = (Invoke-RestMethod https://api.github.com/repos/gmrdad82/pito-compare/releases/latest).tag_name
Invoke-WebRequest "https://github.com/gmrdad82/pito-compare/releases/download/$v/pcmp-$v-windows-x86_64.zip" -OutFile "$env:TEMP\pcmp.zip"
Expand-Archive "$env:TEMP\pcmp.zip" "$env:LOCALAPPDATA\pcmp" -Force
[Environment]::SetEnvironmentVariable('Path', [Environment]::GetEnvironmentVariable('Path', 'User') + ";$env:LOCALAPPDATA\pcmp", 'User')
On Linux and macOS, ~/.local/bin needs to be on your
PATH; on Windows, open a new terminal afterwards. From
source, on any of the three, with Rust 1.97 or newer: cargo install --locked --git https://github.com/gmrdad82/pito-compare
--tag v1.1.2 pito-compare. pcmp needs nothing else to run.
Your first chart
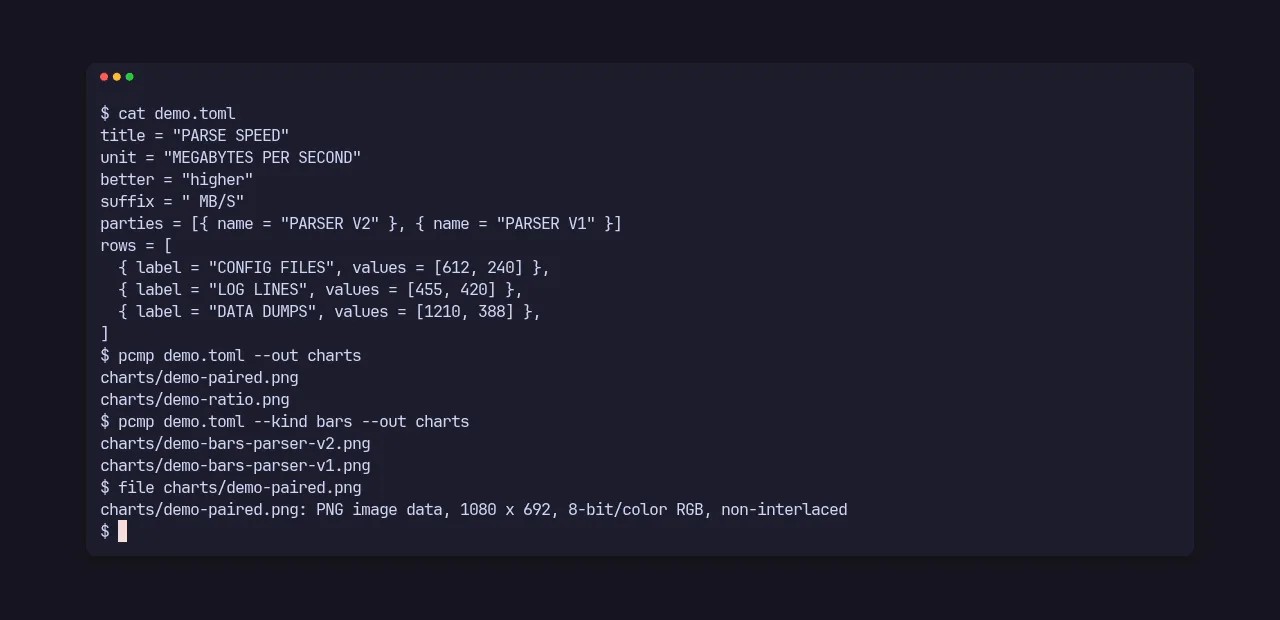
title = "PARSE SPEED"
unit = "MEGABYTES PER SECOND"
better = "higher"
suffix = " MB/S"
parties = [{ name = "PARSER V2" }, { name = "PARSER V1" }]
rows = [
  { label = "CONFIG FILES", values = [612, 240] },
  { label = "LOG LINES", values = [455, 420] },
  { label = "DATA DUMPS", values = [1210, 388] },
]$ pcmp demo.toml --out charts
charts/demo-paired.png
charts/demo-ratio.pngpcmp <DATA> [--out DIR] [--kind all|paired|ratio|bars]
--kind all, the default, draws single bars for one party,
and the paired and ratio charts for two or more. A JSON file with the
same keys works the same.
In a Rust project
[dependencies]
pito-compare = { git = "https://github.com/gmrdad82/pito-compare", tag = "v1.1.2", default-features = false }use pito_compare::{Better, Chart, Group, Kind, Row};
let mut chart = Chart::new("DECODE SPEED", "FRAMES PER SECOND", Better::Higher, &["OURS", "THEIRS"]);
chart.suffix = " FPS".into();
chart.groups.push(Group { name: "CPU".into(), rows: vec![Row::new("H.264 1080P", &[412.0, 298.0])] });
for (kind, canvas) in pito_compare::render(&chart, Kind::All)? {
canvas.save(format!("decode-{kind}.png").as_ref())?;
}
default-features = false leaves out the command line and its clap.
The charts it draws
One dark look, 1080 px wide, so charts from different runs and projects sit side by side. The examples in this section are pito-compare's own, drawn from its examples/ folder, whose numbers are made up.
-
01
Paired bars
Every party's value on one shared linear axis from zero, the value beside each bar, and per row how many times faster or slower the first party is than the one it is compared with.
Rows fall under group headings, a row can carry a mark such as
*or†, and notes under the chart explain them.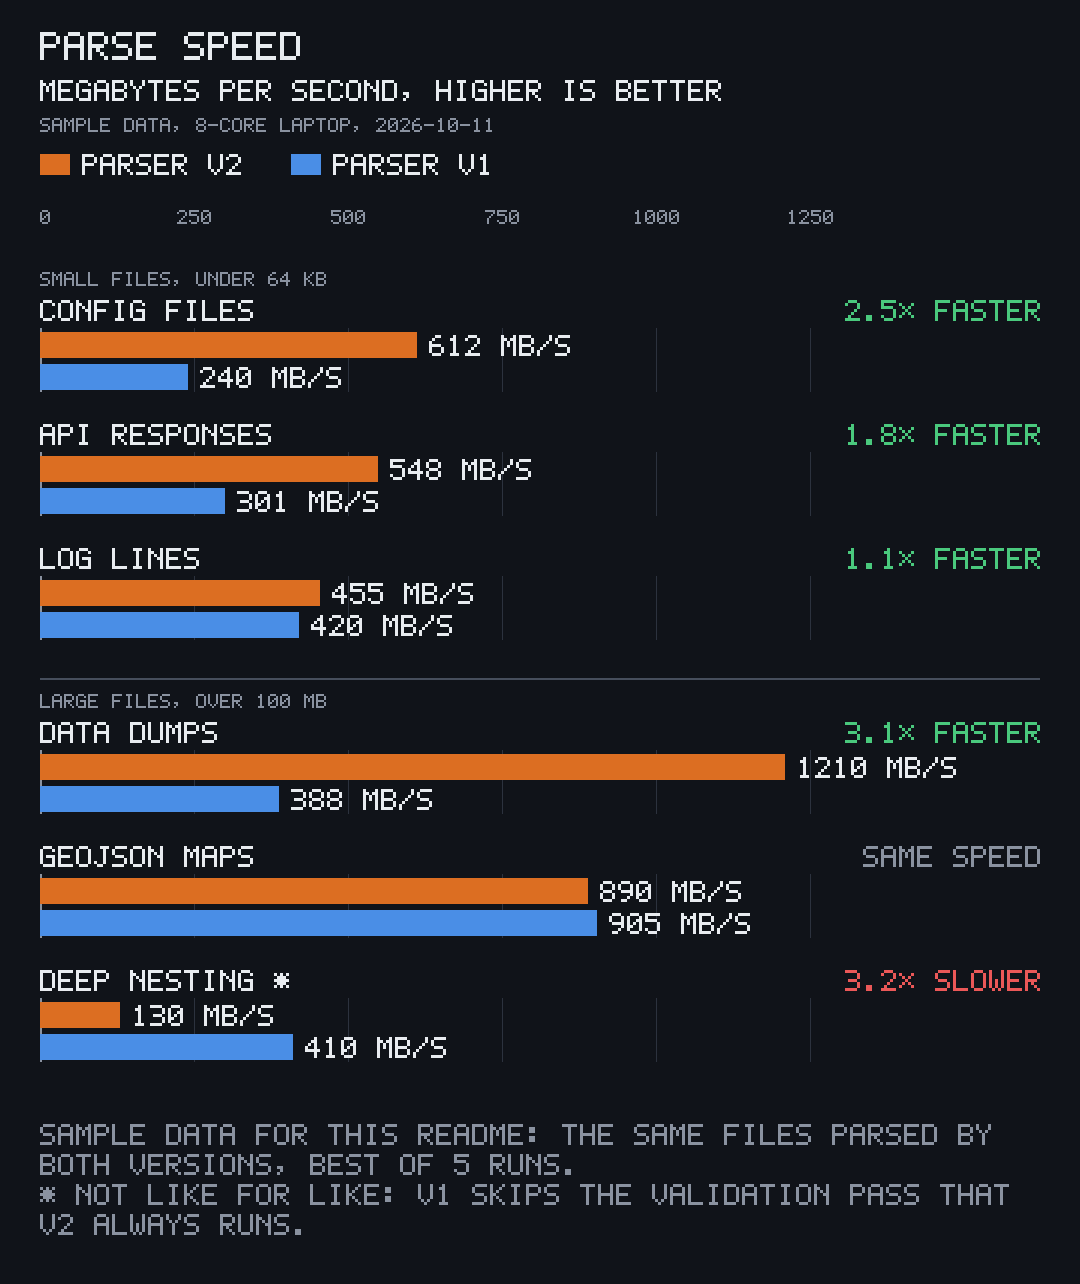
Sample data from pito-compare's examples/speed.toml. -
02
Three or more parties
Up to 12 parties on the same axis.
versusnames the one the first party's tags compare with, so a third party can stand there for scale;better = "lower"turns the axis for times and latencies.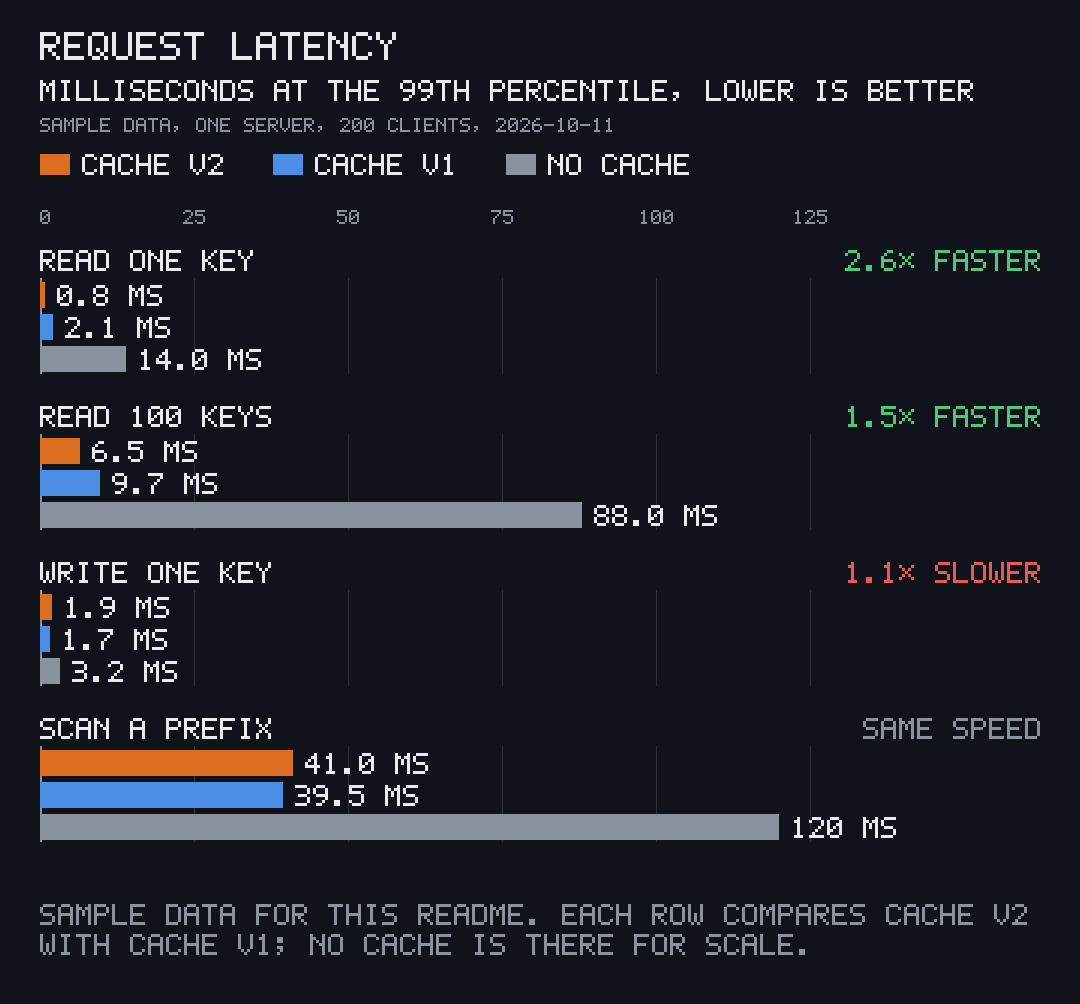
Sample data from pito-compare's examples/latency.json. -
03
Balanced ratios
1× in the middle, slower to the left and faster to the right on a symmetric log scale, so 3× slower is as long as 3× faster. pcmp draws it next to the paired bars for any data with two or more parties.
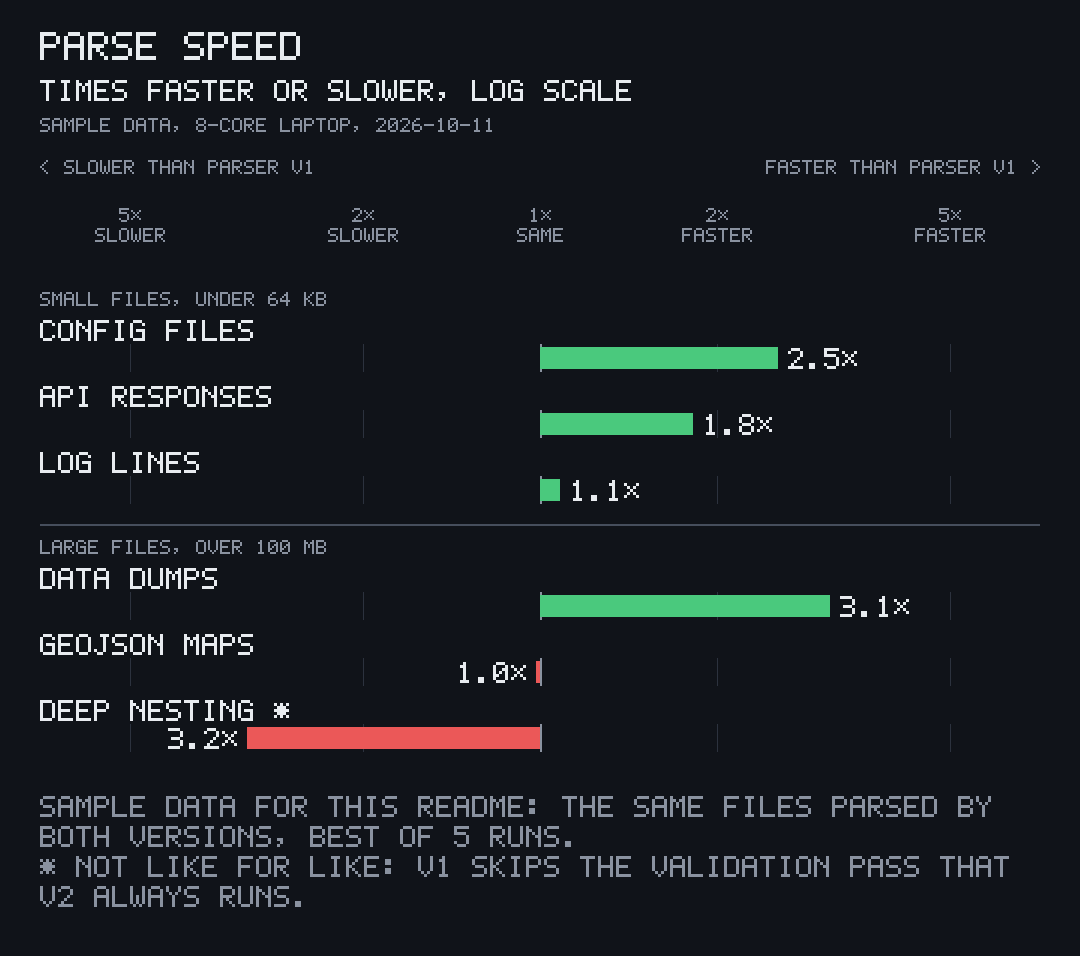
The same sample data as a balanced ratio chart. -
04
Single bars
One party's values, when there is nothing to compare.
--kind barswith several parties draws one chart per party.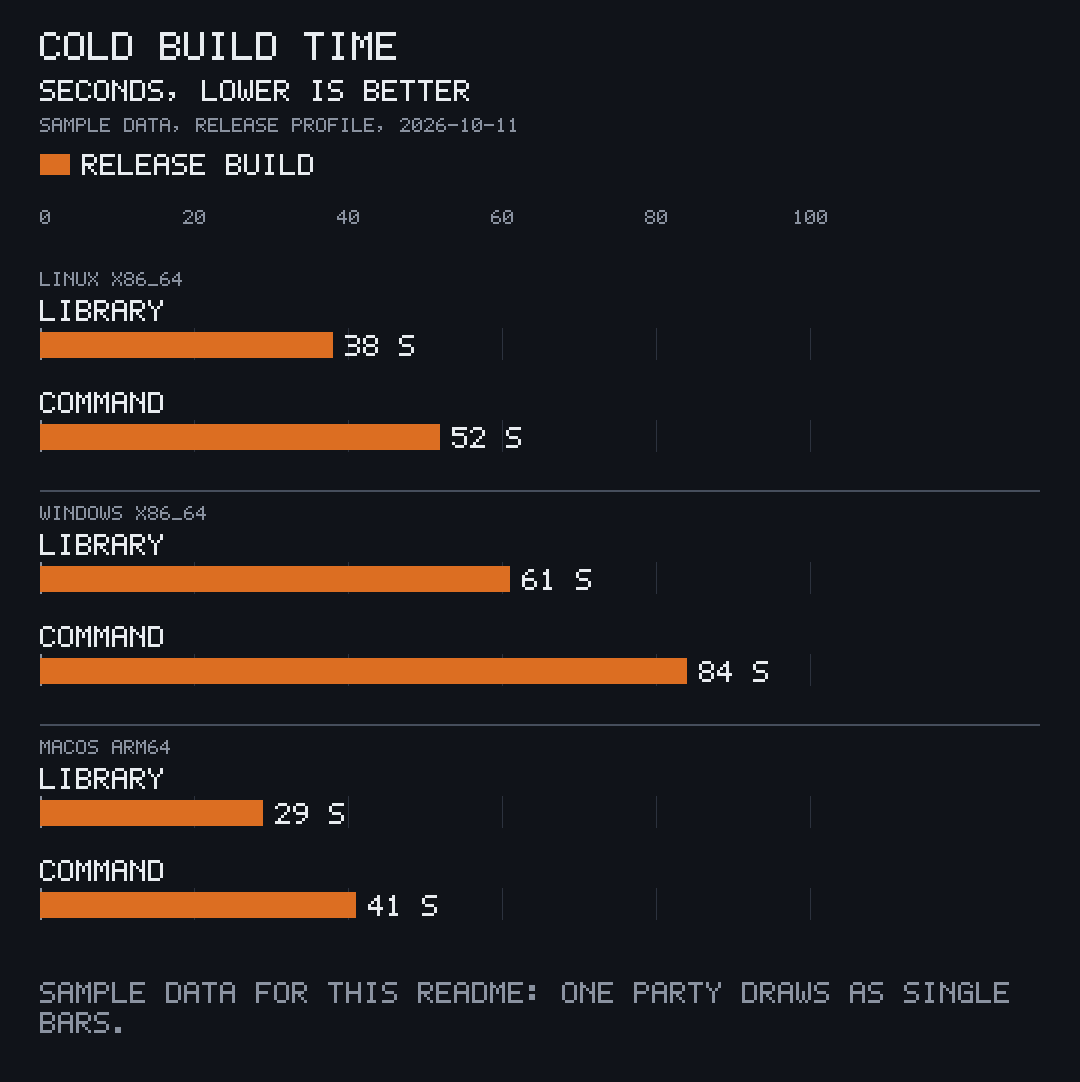
Sample data from pito-compare's examples/build.toml. -
05
Your colours
A party's
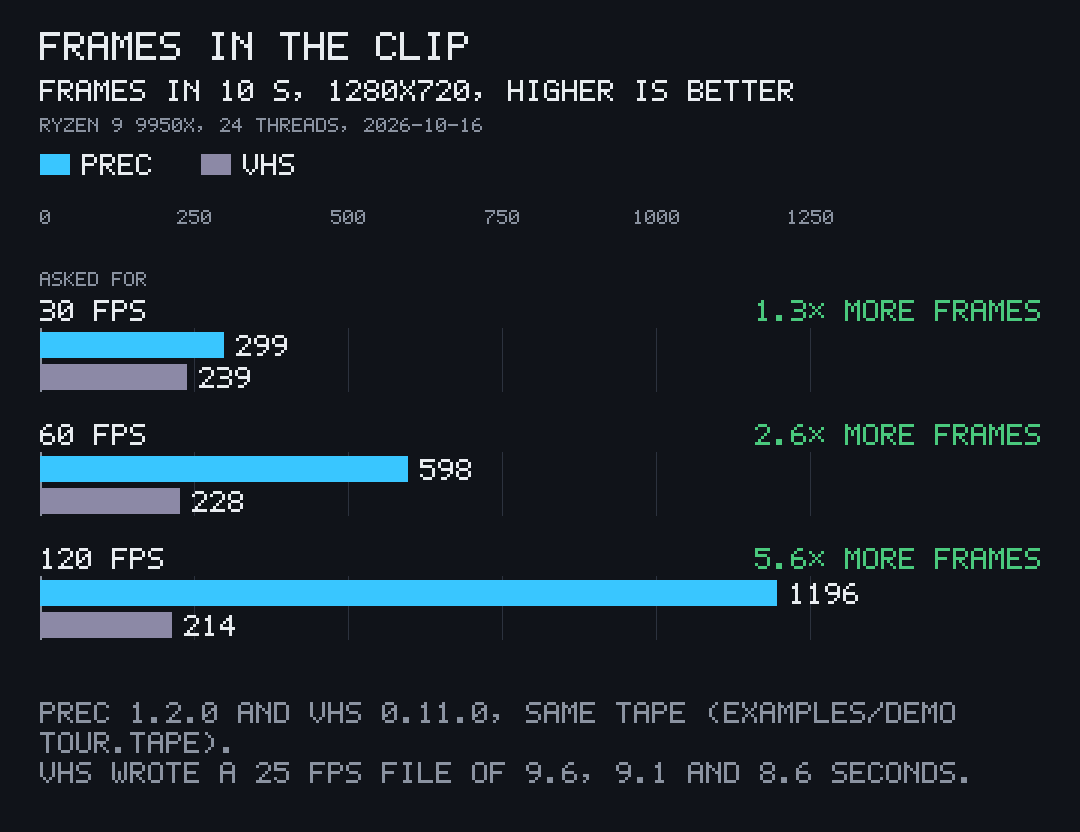
colouris any#RRGGBBor one of the chart's roles (ours,theirs,dim,text,faster,slower); the legend and the bars follow it. The charts on these pages wear each project's own colour.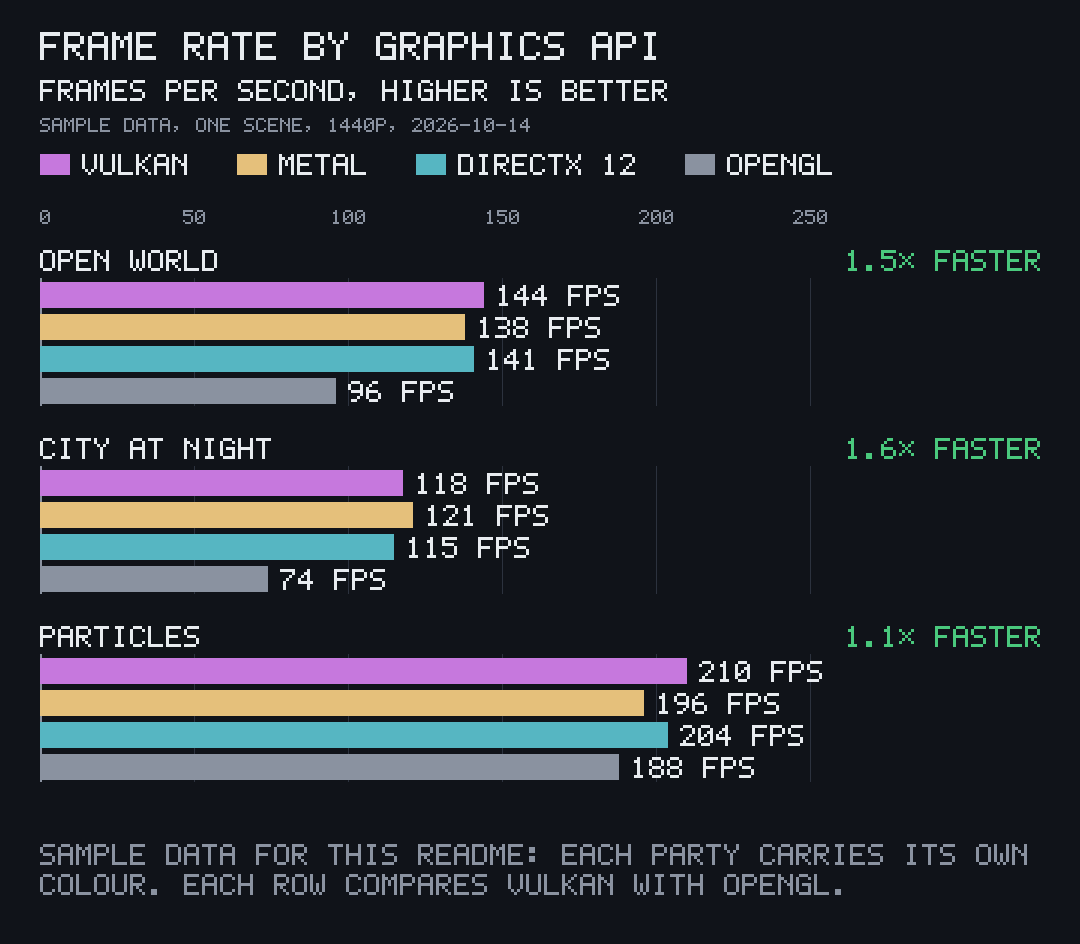
Sample data from pito-compare's examples/frames.toml. -
06
Never a wrong chart
Any character the font can't draw, an unknown key, a negative value or text too long for its line is refused with one line naming the file and the field, and no PNG is written.
Exit 0 when every chart was drawn, 1 when the data couldn't be read or drawn, 2 when the command line is wrong. pcmp's tests draw every chart in its README and compare it with the image there.
A refused file $ pcmp bad.toml pcmp: bad.toml: groups[0].rows[0].values holds -612: values are finite and zero or more
Where PITO MD runs it
Every chart on PITO MD's open-source pages, and in the READMEs behind them, is drawn by pcmp.
-
pito-codecs
Where its look comes from
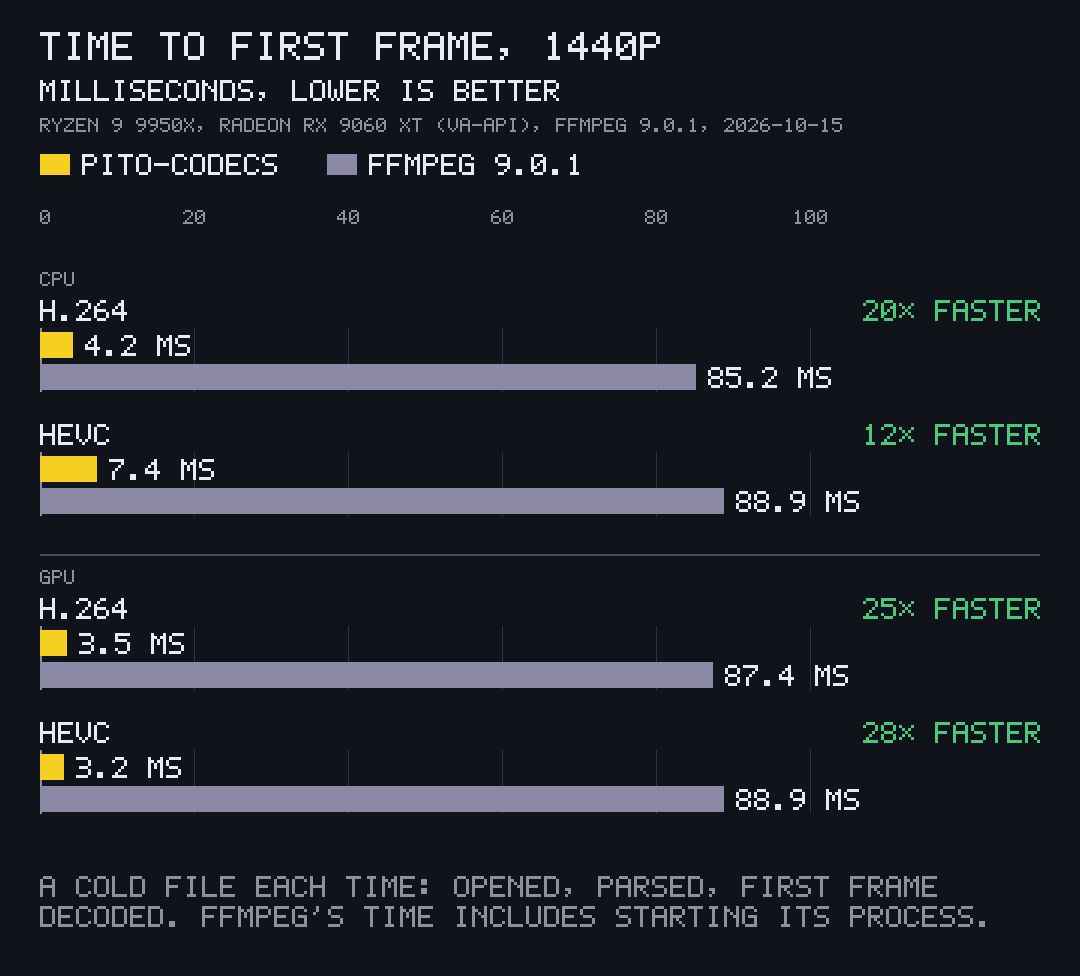
pito-compare is the chart drawer of pito-codecs' benchmarks made into a tool, with its exact look. It draws every chart on pito-codecs' page and README.
See pito-codecs' speed -
prec
prec against VHS
The frames, re-render and size charts on prec's page come from pcmp, drawn from prec's bench data.
See prec's speed -
pito-tui
Frame times
pito-tui's frame-time charts, average and worst of 1,000 frames, are pcmp's too.
See pito-tui's speed
Read it. Run it. It's MIT.
The code is MIT licensed, © Catalin Ilinca: read it, fork it, ship it in your own work. The pito-compare, pcmp and PITO MD names and their logos are © Catalin Ilinca, all rights reserved, and are not covered by the MIT licence.
Issues are welcome on GitHub: a chart that comes out wrong, with the data file that draws it, or an idea for a chart pcmp should draw. Pull requests aren't taken.
Credits
The clip is pito-compare's own shot, recorded by prec and made a GIF; the example charts are pito-compare's README images, drawn by pcmp from its examples/, whose numbers are made up, and its bench/, whose numbers are measured. pito-compare's drawing, colours and pixel font come from pito-codecs' benchmark charts.
Set in Archivo by Omnibus-Type and Atkinson Hyperlegible Mono by the Braille Institute, both under the SIL Open Font License.