
pito-compare, measured
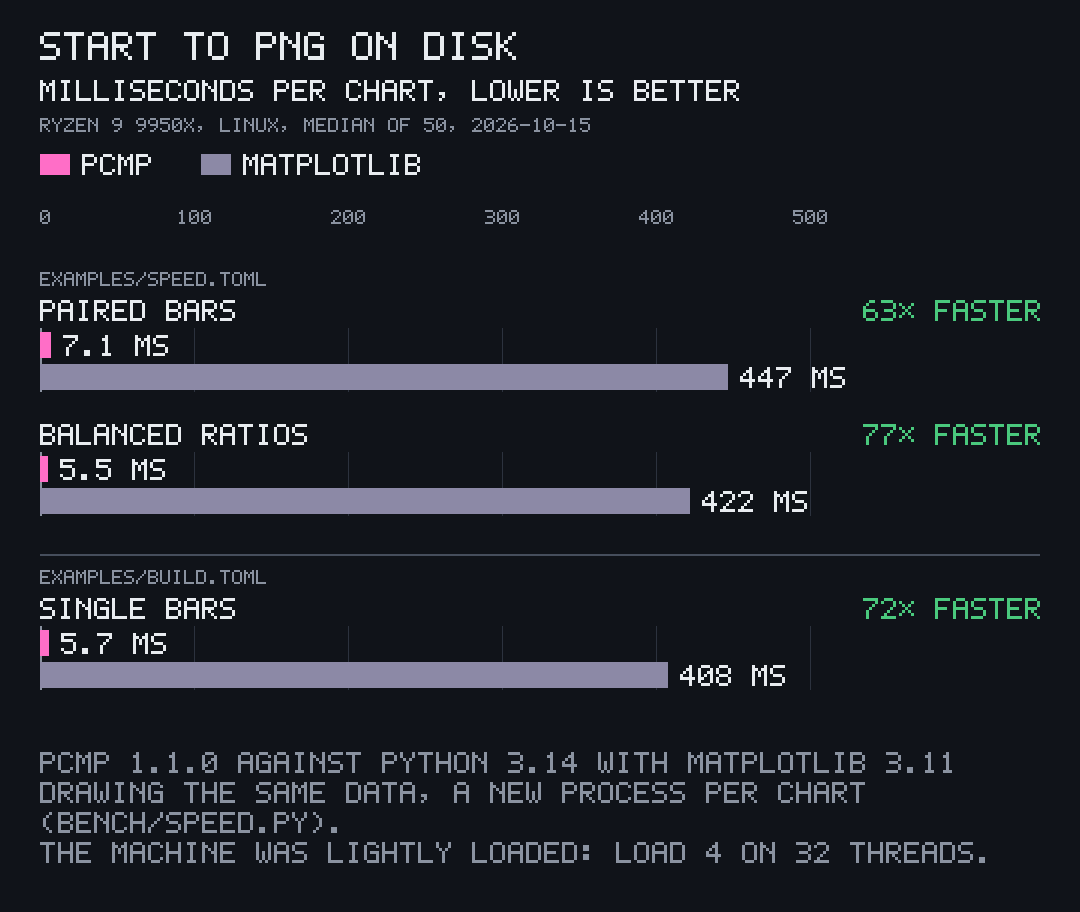
pcmp draws its own benchmark: bench/speed.py times each chart kind, a new process per chart, 50 runs each, then matplotlib drawing the same data the same way.
Against matplotlib
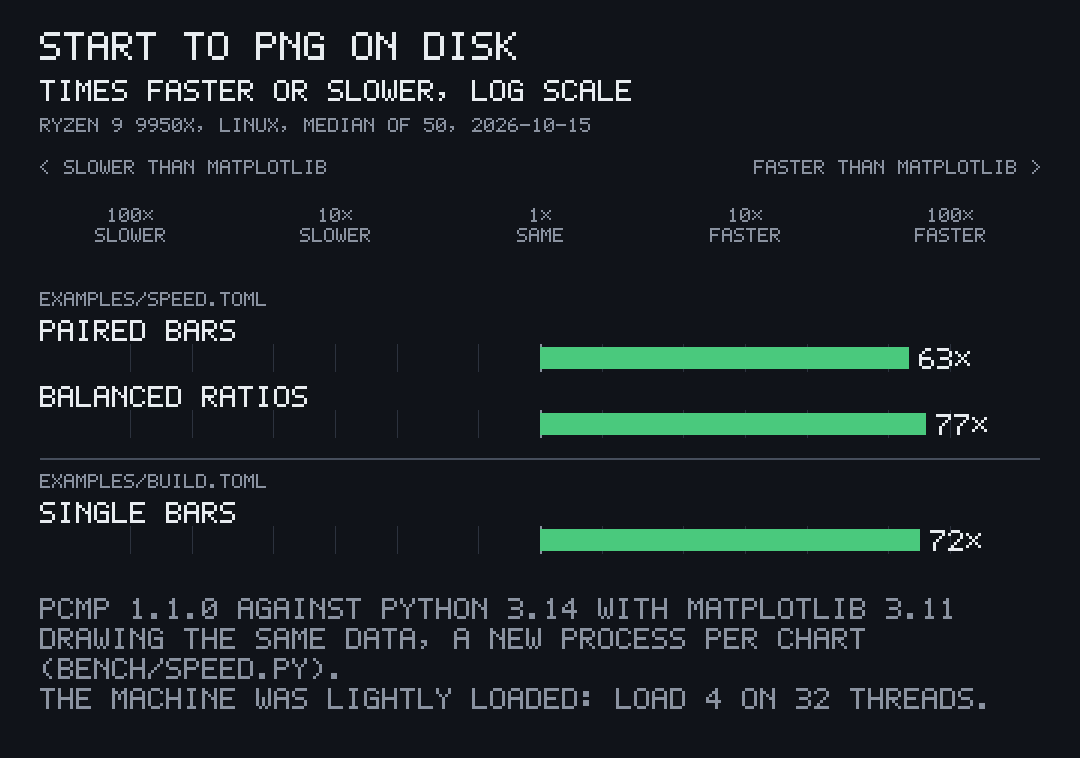
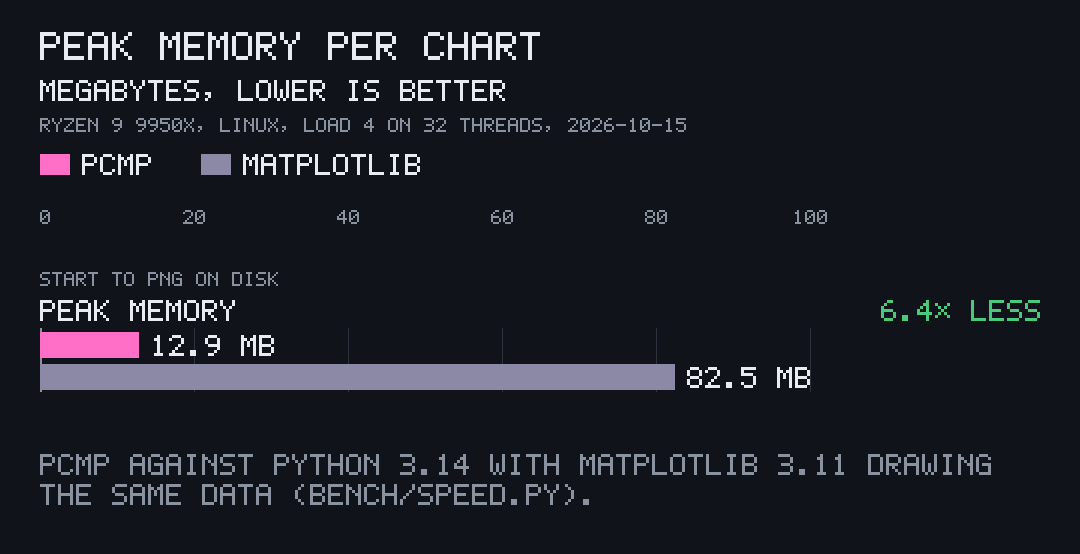
Start to PNG on disk, how many times faster, and the memory each one takes.
Not only the import
Most of matplotlib's time is Python and its import, but not all: in one run, drawing and saving after the import took 129 to 162 ms per chart, over twenty times pcmp's whole run.
At a glance
Time, memory, size, code and build, as pito-compare's README lists them.
| Time per chart, start to PNG on disk | 5.7 ms single bars, 5.5 ms balanced ratios, 7.1 ms paired bars |
|---|---|
| Against matplotlib 3.11, same data | 63× to 77× faster (408 to 447 ms per chart) |
| Peak memory | 12.9 MB (matplotlib: 82.5 MB) |
| Binary | 1.2 MB (1,225,248 bytes, Linux x86_64, release profile, stripped) |
| Code | 1,271 non-blank lines of Rust, canvas, pixel font and charts included |
| Dependencies | 5 direct (png, serde, serde_json, toml, and clap for the command line); 40 crates in all, 27 for the library without clap |
| Release build from clean | 21.6 s |
How it was measured
Measured on 2026-10-15 on an AMD Ryzen 9 9950X (32 threads) under Linux, with Rust 1.97.1, on a lightly loaded machine (load 4 on 32 threads); times are the median of 50 runs, a new process per chart. bench/speed.py times pcmp, then Python 3.14 with matplotlib 3.11 drawing the same data; bench/pcmp-vs-matplotlib.toml holds the numbers it printed, and pcmp drew the charts above from it.
Every number is from pito-compare's README at v1.1.1.
Run it yourself
cargo build --release
python3 bench/speed.py
Read it. Run it. It's MIT.
The code is MIT licensed, © Catalin Ilinca: read it, fork it, ship it in your own work. Its name and logos, and PITO MD's, are © Catalin Ilinca, all rights reserved, and are not covered by the MIT licence.